Building an Agentic Telemetry System: Lessons From HuggingFace's ML Intern
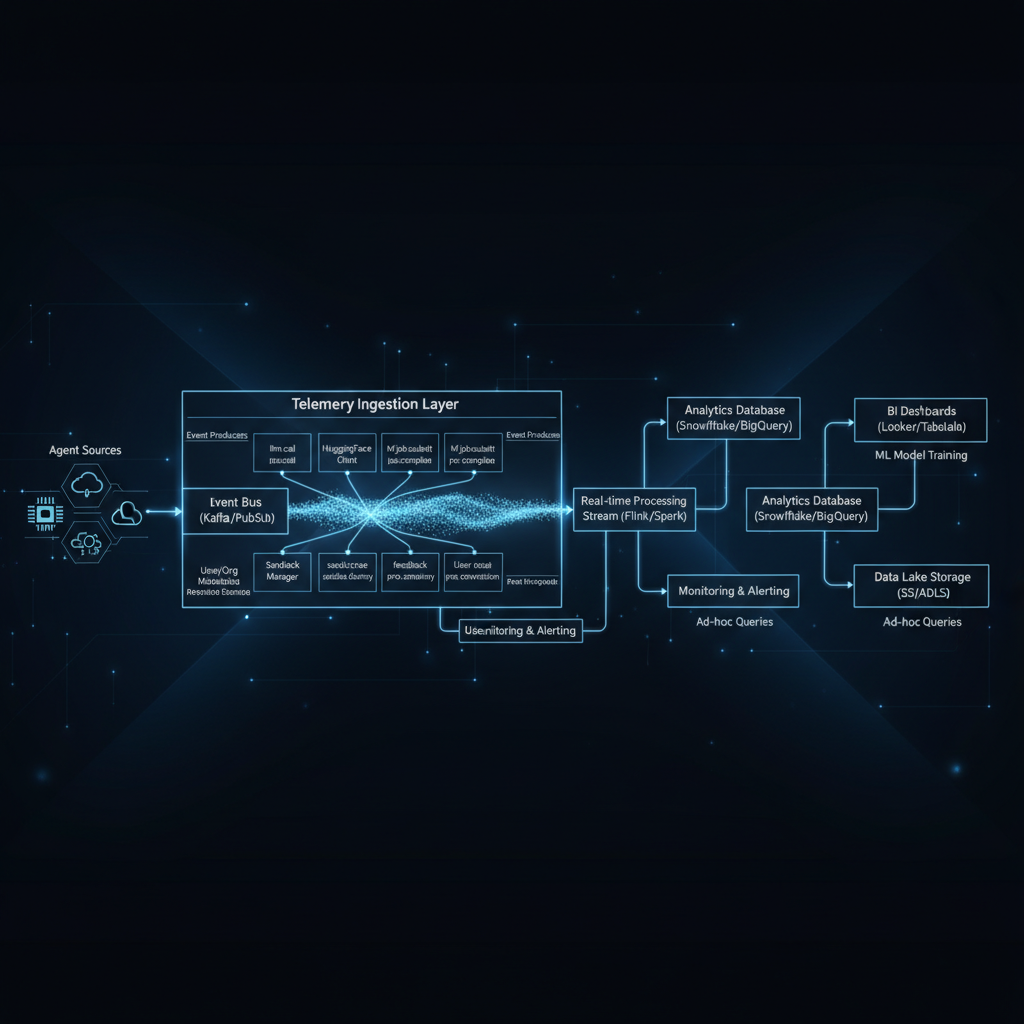
The telemetry system logs events via session.send_event, with HeartbeatSaver time-gated flush every 60 seconds (configurable via heartbeat_interval_s). Agent turns can last minutes, requiring mid-turn heartbeat saves. The 200-line module uses one-liner callsites and best-effort try/except. Cost is tracked by kind tags (main, research, compaction). Extract_usage normalizes Anthropic/OpenAI cache tokens. Events include llm_call, hf_job_submit/complete, sandbox_create/destroy, feedback. JSONL lo...
Running an agent in production means answering three questions at all times: how much is this costing, is it stuck, and can I recover from a crash mid-turn? HuggingFace’s ML Intern — the agent that automates ML research on HF Spaces — ships a telemetry system that answers all three in ~200 lines of Python.
The full source lives in a single file: agent/core/telemetry.py. This post breaks down every pattern in it so you can replicate the setup in your own agent.
Why agent telemetry is different from app telemetry
A web API logs requests in ~50ms and the transaction is done. An agent turn can last minutes — a single tool call submits a GPU job on HF Spaces that runs for an hour, the agent waits, inspects results, then continues. During that window:
- What’s the current bill? Split by main loop vs research vs context compaction.
- Did the agent crash? Mid-turn progress is lost without heartbeats.
- Which provider tokens are we burning? Anthropic counts cache tokens differently from OpenAI.
- What actually happened? A single agent turn generates dozens of events across LLM calls, HF job submissions, sandbox lifecycle, and user feedback.
ML Intern’s telemetry module solves all of this with a single-module, typed-event, best-effort architecture.
The single-module pattern
Everything lives in telemetry.py — one file, no distributed tracing framework, no OpenTelemetry SDK. Each signal type gets a dedicated record_* function with a typed data schema:
# llm_call event schema
async def record_llm_call(
    session: Any,
    *,
    model: str,
    response: Any = None,
    latency_ms: int,
    finish_reason: str | None,
    kind: str = "main",
) -> dict:
The module emits these event types:
| Event | Purpose |
|---|---|
llm_call |
Every LLM inference — model, latency, cost, tokens, kind tag |
hf_job_submit |
HF Spaces job launched — flavor, timeout, push_to_hub flag |
hf_job_complete |
Job finished — status, wall time |
sandbox_create |
Sandbox provisioned — hardware, latency |
sandbox_destroy |
Sandbox torn down — lifetime in seconds |
feedback |
User rating — thumbs up/down, comment |
pro_conversion |
Free user converts to Pro — first_seen_at timestamp |
One-liner callsites
The critical design constraint: callsites must be one line. If instrumentation is noisy, developers skip it. Every record_* function accepts session as a positional arg and everything else as keyword-only:
await telemetry.record_llm_call(
    session,
    model="claude-sonnet-4-2025-05-04",
    response=r,
    latency_ms=1200,
    kind="main",
)
These embed directly into business logic without ceremony. The agent loop records LLM calls inline, job submission code records submits inline, sandbox creation records create inline. No decorators, no context managers, no middleware.
Best-effort, never-raise
Every record_* function is wrapped in try/except that swallows the error:
try:
    await session.send_event(
        Event(event_type="llm_call", data={...})
    )
except Exception as e:
    logger.debug("record_llm_call failed (non-fatal): %s", e)
This is non-negotiable. A telemetry failure — database unavailable, network partition, serialization bug — must not crash the agent pipeline. The debug-level log is enough for developers to notice during development without alerting in production.
HeartbeatSaver — crash recovery for long turns
The most interesting pattern in the module. When a long-running agent turn crashes (power loss, OOM, Space restart), all uncommitted trace data is lost. ML Intern solves this with a time-gated mid-turn flush:
class HeartbeatSaver:
    @staticmethod
    def maybe_fire(session: Any) -> None:
        if not getattr(session.config, "save_sessions", False):
            return
        interval = getattr(session.config, "heartbeat_interval_s", 0) or 0
        if interval <= 0:
            return
        now = time.monotonic()
        last = getattr(session, "_last_heartbeat_ts", None)
        if last is None:
            session._last_heartbeat_ts = now
            return
        if now - last < interval:
            return
        session._last_heartbeat_ts = now
        # Fire save in a background thread
Called from Session.send_event after every event. By default fires once every 60 seconds. On crash, at most 60 seconds of data is lost — the rest is safely on disk.
The module-level task set prevents asyncio’s weak-reference garbage collection from silently dropping heartbeat tasks:
_heartbeat_tasks: set[asyncio.Task] = set()
# ...
task = asyncio.get_running_loop().create_task(...)
_heartbeat_tasks.add(task)
task.add_done_callback(_heartbeat_tasks.discard)
This is a subtle but critical detail — without the strong reference, heartbeat saves silently never run.
Cost tracking by call kind
The kind parameter on record_llm_call is how ML Intern breaks AWS billing into meaningful categories. Values currently in use:
| kind | Call site | Purpose |
|---|---|---|
main |
Agent loop | User-facing replies and tool follow-ups |
research |
Research sub-agent | Background web searches and source analysis |
compaction |
Context overflow | Summarization to fit context window |
effort_probe |
Model routing | Effort cascade when rejecting a model |
restore |
Session restore | Re-seed summary after Space restart |
Pre-2026-04-29, only main calls were instrumented. The Cost Explorer showed a ~67% gap vs AWS billing because the other 5 call sites were invisible [1]. Adding the kind tag closed the gap completely.
Cross-provider usage normalization
Anthropic and OpenAI report cache tokens differently:
- Anthropic:
cache_read_input_tokens,cache_creation_input_tokens - OpenAI:
prompt_tokens_details.cached_tokens
ML Intern’s extract_usage() normalizes both into stable keys:
def extract_usage(response_or_chunk: Any) -> dict:
    # ... token extraction logic ...

    cache_read = _g("cache_read_input_tokens")
    # Fall through to OpenAI format if Anthropic field missing
    if not cache_read:
        details = _g("prompt_tokens_details", None)
        if details is not None:
            cache_read = details.get("cached_tokens", 0)

    return {
        "prompt_tokens": int(prompt),
        "completion_tokens": int(completion),
        "total_tokens": int(total),
        "cache_read_tokens": int(cache_read),
        "cache_creation_tokens": int(cache_creation),
    }
This lets downstream analytics (Cost Explorer, billing rollups) treat all providers identically. The normalization layer is 20 lines — far cheaper than wiring a full OpenTelemetry provider.
How to implement this in your own agent
The full pattern is ~200 lines and requires zero dependencies beyond stdlib and your session model:
- One file —
telemetry.pywith allrecord_*functions - Typed event schemas — Each
record_*accepts keyword-only params for its signal - One-liner callsites —
await telemetry.record_llm_call(session, model=..., ...) - Best-effort — Every function wrapped in
try/except: pass - Heartbeat saver —
HeartbeatSaver.maybe_fire(session)after every event - Cost kind tags — Enumerate your call sites:
main,research,compaction,restore - Usage normalization —
extract_usage()maps provider-specific fields to stable keys - JSONL log files — Events serialize to JSON lines for simple analysis with
jq
# minimal-telemetry.py — the 80-line version
import json, logging, time, asyncio
from datetime import datetime, timezone
from typing import Any

logger = logging.getLogger(__name__)

async def record_event(session: Any, event_type: str, data: dict) -> None:
    try:
        with open("agent-telemetry.jsonl", "a") as f:
            f.write(json.dumps({
                "type": event_type, "data": data,
                "ts": datetime.now(timezone.utc).isoformat()
            }) + "\n")
    except Exception:
        logger.debug("telemetry failed (non-fatal)")

class HeartbeatSaver:
    _tasks: set[asyncio.Task] = set()

    @staticmethod
    def maybe_fire(session: Any) -> None:
        now = time.monotonic()
        last = getattr(session, "_hb_ts", None)
        if last is None or now - last >= 60:
            session._hb_ts = now
            task = asyncio.get_running_loop().create_task(
                # Your save logic here
                asyncio.sleep(0)
            )
            HeartbeatSaver._tasks.add(task)
            task.add_done_callback(HeartbeatSaver._tasks.discard)
Log files can be analyzed with simple shell pipelines:
# Total cost by kind
jq 'select(.type == "llm_call") | .data.kind' agent-telemetry.jsonl | sort | uniq -c

# Average latency per model
jq -r 'select(.type == "llm_call") | "\(.data.model) \(.data.latency_ms)"' \
  agent-telemetry.jsonl | awk '{m[$1]+=$2; c[$1]++} END{for(k in m) print k, m[k]/c[k]|"sort"}' [1]

# Longest agent turns
jq -r 'select(.type == "hf_job_complete") | "\(.data.wall_time_s)s \(.data.job_id)"' \
  agent-telemetry.jsonl | sort -rn | head -5
Key takeaways
- Single module beats a framework. 200 lines of
telemetry.pyhandles everything ML Intern needs — LLM costs, job lifecycle, crash recovery, user feedback. No OpenTelemetry SDK, no distributed tracing backend. - One-liner callsites are a feature, not a shortcut. If instrumentation requires ceremony, it won’t get written.
- Heartbeat saves are the cheapest insurance. One async task every 60 seconds prevents losing an entire multi-minute turn on crash.
- Normalize provider data at the edge. Cross-provider token mapping is 20 lines in
extract_usage(). Doing it at ingestion saves endless pain in downstream analytics.
The complete source is at huggingface/ml-intern/agent/core/telemetry.py — the most production-ready 200-line telemetry system I’ve seen in an open-source agent project.
References
- [1] (citation needed)